How much methane does a cow actually produce?

Cows are notorious for the amount of methane they produce. Methane is a powerful greenhouse gas (GHG), but just how much do cows actually give off and how does this compare to other methane emission sources? This post tries to give an overview of all things methane and cows..

Where does the methane come from?

The plant diet of cows and other ruminants is high in cellulose, which cannot be digested by the ruminant itself. However, ruminants have a symbiotic relationship with colonies of microorganisms, called methanogens, which live in their gut and break down the cellulose into carbohydrates.. These carbohydrates provide both the microbial community and the ruminant with an energy source. Methane is produced as a by-product of this process.

A common misconception is that the cow’s rear end emits methane, however the vast majority is released orally. Researched carried out by Grainger et al. in 2007 found that 92-98 % was emitted orally (I won’t go into detail about how they found that out!). It is also wrong to think that all bovines emit the same amount of methane but I will go into this in more detail later on in the post.

Global Bovine Emissions

Global emissions of methane were estimated to be between 76 – 92 Tg per year (1 Tg = 1 million metric tonnes). This is roughly equal to ~10-15 % of global methane emissions, which in turn is ~15 % of global GHG emissions. Methane is a more potent GHG than CO2, which means that gram for gram methane warms the atmosphere more than CO2. Methane also has a much shorter lifetime in the atmosphere compared to CO2 (~10 years compared to 100s of years) which will produce more rapid impacts on the global climate. This also means that any reductions in methane emissions will see a faster decrease in atmospheric concentrations than compared to CO2.

Dairy vs. Beef (and some other animals)

The table and figure below compares farmed animals in the UK and their contribution to methane emissions per animal per year in kilograms. A dairy cow emits over twice the amount of methane than a beef cow and is by far the highest contributor of all the animals studied. There are also more dairy cows in the UK than beef cattle (1.81 million compared to 1.66 million). All data found from the UK GHG Inventory report 1990-2012. Other research has shown that cows emit methane at regular times of the day, specifically during feeding and milking. Although these figures do not take into account farming and transport GHG emissions and the actual amount of milk each animal produces, perhaps it would be better to buy goat milk? Although the more preferable metric of Carbon per Litre would allow a more concrete conclusion on this point.

Kg CH4 # Dairy Cows
Pigs 1.5 74
Goats 5 22
Sheep 8 14
Beef 50.5 2
Dairy 110.7 1
Graphics credit to @OatJack.

Graphics credit to @OatJack.

Future Bovine Emissions

Future methane emissions are almost certainly expected to increase due to global food demand increasing from population growth. Developed nations also consume more meat, developing nations are thus expected to increase their meat consumption in future years.

Methods to reduce methane emissions from cows are summarised in the table below (taken from Reay’s book Methane and Climate Change). These have been classified into short term (available now), medium term (available in ten years) and long term (not commercially available for at least another ten years). Many of these suggestions have been disputed as they are not economically viable, especially in developing nations.

Short Term Medium Term Long Term
Reduce animal numbers Rumen Modifiers Targeted manipulation of rumen ecosystem
Increase productivity per animal Select plants that produce lower methane yield by the animals Breed animals with low methane yield
Manipulate diet
Rumen Modifiers

An alternate pathway would be to try and capture emissions from cows. A dairy cow can produce up to 400 litres of methane per day! When burned, this is enough energy to power a small fridge for a day. Some scientists have harnessed methane emitted from cows in backpacks (see photo and video below) however scaling this up to all 10 million cows (this includes all calves, young bulls etc in the UK alone) could be problematic!

CowPack

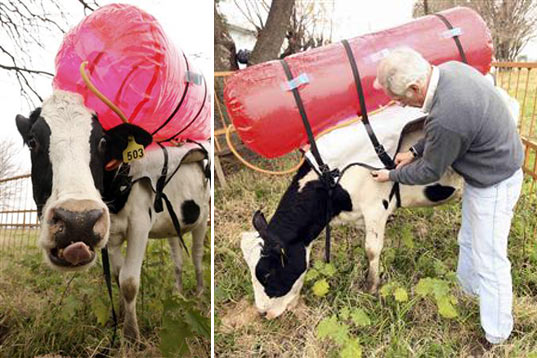
Methane backpack. Image sourced from here: http://inhabitat.com/spiffy-backpack-traps-bovine-gas/

Click for the video: “Backpacks measure cows’ methane” (BBC News)

If you have any questions concerning this post please ask in the comments below!

4.5 Billion Years of the Earth’s Temperature

This blog post will give a brief overview of how the Earth’s temperature has changed up to the present day. We only have actual temperature measurements going back a couple of hundred years however there are several other methods we can use to give reliable estimates of the Earth’s temperature in the past. ‘Proxy’ measurements include rock sediment sampling, tree rings and ice cores. The video below gives a good introduction to how the British Antarctic Survey use ice cores to generate accurate atmospheric gas and temperature records going back 800,000 years! The diagram below shows an overview of the Earth’s temperature from 500 million years ago to the present and may help with picturing the changes in temperature when reading this post.

 Very Early Earth’s History (4.5 billion – 3.8 billion years ago)

The Earth was formed roughly 4.5 billion years ago. Until 3.8 billion years ago it was a completely inhospitable environment with the surface being mainly molten lava. The Earth eventually cooled enough for its crust to form. Land masses could then exist and, when it was cold enough to rain, the oceans formed.  Around this time the atmosphere was predominantly consisted of methane (CH4) and ammonia (NH3), two extremely important greenhouse gases, thus their radiative forcing kept the Earth’s atmosphere warm and toasty!

The Oxygen Explosion (2.5 billion – 500 million years ago)

Oxygen (O2) in the atmosphere was almost non-existent until ~2.5 billion years ago. The evolution of cyanobacteria, which produced oxygen as a bi-product of photosynthesis, meant that Olevels dramatically increased. This rapid change in atmospheric composition caused widespread extinctions of most of the previous anaerobic bacteria. This ‘new’ atmosphere made the Earth much colder as there were no longer bacteria emitting radiative forcing-methane and carbon dioxide into the atmosphere. It is thought that the average temperature at the equator was roughly the same as current Antarctic conditions!

History of the Earth's Temperature. originally sourced from here.

History of the Earth’s Temperature. originally sourced from here.

500 – 250 million years ago

During this period the Earth’s atmosphere became more stable, eventually cooling to similar temperatures to today’s average (see first section on plot above where the temp change is ~0 ΔT).

Animal Evolution (250 65 million years ago)

During this time the evolution of aerobically respiring animals occurred, i.e. DINOSAURS! This meant the concentration of CO2 increased and global temperatures increased again. We know that there was a sudden decrease in temperatures around 65 million years ago which resulted in the extinction of the dinosaurs. The most widely accepted reason for this is a massive comet hitting the Earth sending huge amounts of matter (read: aerosols) into the atmosphere. This caused a global decrease in temperature due to an increased albedo effect (for more information about this and the contribution of aerosols to this effect please read my previous blog: An introduction to aerosols).

Thermal Maximum (55 million years ago)~55 million years ago, records show a massive warming of between 5-8 ⁰C in just 20,000 years (It is thought that during this time it was so warm palm trees could have grown in the poles!). The direct cause is still disputed amongst scientists, however it is generally agreed that a sudden release of carbon into the atmosphere caused the warming. This was probably in the form of methane from either the ocean bed or from within ice structures called clathrates. It was after this period that mammals started to evolve.


Ice Age (35 million years ago)

The thermal maximum continued to around 35 million years ago when the Earth cooled into the Ice Age. The theory behind this change in temperature is that a type of fern named Azolla became extinct. The Azolla then sank to the bottom of the ocean, taking with it much of the carbon absorbed as carbon dioxide, therefore removing it from the atmosphere. With the carbon dioxide not present to act as a greenhouse gas, global temperatures decreased again. Unlike the last period of cooling, this time the Earth had fully formed continents, including mountain ranges, and land mass at the South Pole (Antarctica). This new land coverage helped amplify the cooling via circulation.

An ice age is defined as when a planet’s poles are covered with ice, so technically we are still in one! Within an ice age there are periods of glacials and inter-glacials. Glacials are episodes of colder temperatures whereas inter-glacials are warmer time phases. Both will last several thousands of years. These changes in climate can be explained with the Milankovitch cycles (please read post #2 – The Milankovitch Cycles – for more information). NB: You can see on the plot above sections labelled ‘the mini ice age’ and ‘the medieval warming’ period. I plan to do future blogs on these events as this post is getting far too long!

Recent Warming (1880 – present day)

The warming we have seen in recent years has been like nothing experienced before in the Earth’s history. The last 100 years of warming has cancelled out the previous 6000 years of cooling that occurred before. The video below (sourced from NASA) shows just how dramatic the rate of global warming is over this time period.

Thanks for reading to the end of this post, it ended up a bit too long! Next time I want to introduce an event called the Northern Atlantic Oscillation: the phenomenon that is thought to have caused the medieval warming period.