My second post (The Milankovitch Cycles) was recently linked to another blog post. This post, which is a bit more ‘sciencey’ than mine, gives a new approach to the Milankovitch Cycles. It states that the variation in energy on the Earth’s surface because of these cycles is not enough to explain the amount of global temperature variation. It then explains that a recent publication by Abe-Ouchi, A. et al. (2013) can explain these discrepancies using a climate model. Results show that ice-sheets formed on the Canadian Shield are key to the variation in the Earth’s climate. To read the blog post in full please click the link below:
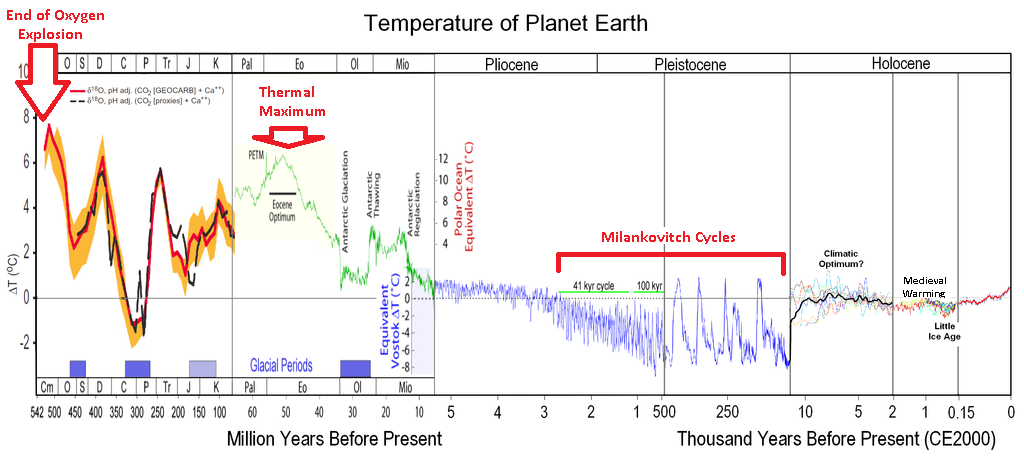
This blog post will give a brief overview of how the Earth’s temperature has changed up to the present day. We only have actual temperature measurements going back a couple of hundred years however there are several other methods we can use to give reliable estimates of the Earth’s temperature in the past. ‘Proxy’ measurements include rock sediment sampling, tree rings and ice cores. The video below gives a good introduction to how the British Antarctic Survey use ice cores to generate accurate atmospheric gas and temperature records going back 800,000 years! The diagram below shows an overview of the Earth’s temperature from 500 million years ago to the present and may help with picturing the changes in temperature when reading this post.
Very Early Earth’s History (4.5 billion – 3.8 billion years ago)
The Earth was formed roughly 4.5 billion years ago. Until 3.8 billion years ago it was a completely inhospitable environment with the surface being mainly molten lava. The Earth eventually cooled enough for its crust to form. Land masses could then exist and, when it was cold enough to rain, the oceans formed. Around this time the atmosphere was predominantly consisted of methane (CH4) and ammonia (NH3), two extremely important greenhouse gases, thus their radiative forcing kept the Earth’s atmosphere warm and toasty!
The Oxygen Explosion (2.5 billion – 500 million years ago)
Oxygen (O2) in the atmosphere was almost non-existent until ~2.5 billion years ago. The evolution of cyanobacteria, which produced oxygen as a bi-product of photosynthesis, meant that O2 levels dramatically increased. This rapid change in atmospheric composition caused widespread extinctions of most of the previous anaerobic bacteria. This ‘new’ atmosphere made the Earth much colder as there were no longer bacteria emitting radiative forcing-methane and carbon dioxide into the atmosphere. It is thought that the average temperature at the equator was roughly the same as current Antarctic conditions!
History of the Earth’s Temperature. originally sourced from here.
500 – 250 million years ago
During this period the Earth’s atmosphere became more stable, eventually cooling to similar temperatures to today’s average (see first section on plot above where the temp change is ~0 ΔT).
Animal Evolution (250 – 65 million years ago)
During this time the evolution of aerobically respiring animals occurred, i.e. DINOSAURS! This meant the concentration of CO2 increased and global temperatures increased again. We know that there was a sudden decrease in temperatures around 65 million years ago which resulted in the extinction of the dinosaurs. The most widely accepted reason for this is a massive comet hitting the Earth sending huge amounts of matter (read: aerosols) into the atmosphere. This caused a global decrease in temperature due to an increased albedo effect (for more information about this and the contribution of aerosols to this effect please read my previous blog: An introduction to aerosols).
Thermal Maximum (55 million years ago)~55 million years ago, records show a massive warming of between 5-8 ⁰C in just 20,000 years (It is thought that during this time it was so warm palm trees could have grown in the poles!). The direct cause is still disputed amongst scientists, however it is generally agreed that a sudden release of carbon into the atmosphere caused the warming. This was probably in the form of methane from either the ocean bed or from within ice structures called clathrates. It was after this period that mammals started to evolve.
Ice Age (35 million years ago)
The thermal maximum continued to around 35 million years ago when the Earth cooled into the Ice Age. The theory behind this change in temperature is that a type of fern named Azolla became extinct. The Azolla then sank to the bottom of the ocean, taking with it much of the carbon absorbed as carbon dioxide, therefore removing it from the atmosphere. With the carbon dioxide not present to act as a greenhouse gas, global temperatures decreased again. Unlike the last period of cooling, this time the Earth had fully formed continents, including mountain ranges, and land mass at the South Pole (Antarctica). This new land coverage helped amplify the cooling via circulation.
An ice age is defined as when a planet’s poles are covered with ice, so technically we are still in one! Within an ice age there are periods of glacials and inter-glacials. Glacials are episodes of colder temperatures whereas inter-glacials are warmer time phases. Both will last several thousands of years. These changes in climate can be explained with the Milankovitch cycles (please read post #2 – The Milankovitch Cycles – for more information). NB: You can see on the plot above sections labelled ‘the mini ice age’ and ‘the medieval warming’ period. I plan to do future blogs on these events as this post is getting far too long!
Recent Warming (1880 – present day)
The warming we have seen in recent years has been like nothing experienced before in the Earth’s history. The last 100 years of warming has cancelled out the previous 6000 years of cooling that occurred before. The video below (sourced from NASA) shows just how dramatic the rate of global warming is over this time period.
Thanks for reading to the end of this post, it ended up a bit too long! Next time I want to introduce an event called the Northern Atlantic Oscillation: the phenomenon that is thought to have caused the medieval warming period.
Hello everyone, welcome to my second blog post. I wanted to start off with a diagram that I should have included in my last post. It shows an overview of the world’s energy budget, which includes several terms I described before, including the albedo effect and the greenhouse effect!
In this post I want to explain how the Earth’s temperature is affected over longer timescales as a result of changes in its orbit. These changes can have a significant impact on the Earth’s climate and temperature. The variations in the Earth’s orbit were first discovered by a mathematician named Milankovitch in the early 20th century, whose theories were confirmed in the 1970s. However, to understand why these cycles have such an effect on temperature I should first review the Earth’s annual cycle and why it has seasonality.
The Sun emits energy which travels to the Earth as rays. The amount of heat generated in the atmosphere depends on the angle these rays hit the Earth (their angle of incidence). The figure below shows an example of how the Sun’s rays reach the Earth at two areas. The rays around the equator have a much higher angle of incidence (~90⁰ in relation to the Earth’s surface) and so they cover a relatively small area. In energy terms there is a higher Watts per metre squared value (Wm-2). The rays that reach much higher latitudes have a lower incidence angle and therefore diffuse themselves over a larger area (lower Wm-2). This combined with the Earth being tilted on an axis explains our seasons (NB. Not represented in the figure). In northern hemisphere summer time (NHST) the North Pole is tilted towards the Sun and so the northern hemisphere experiences incoming rays at a high angle of incidence. The opposite occurs northern hemisphere winter time (NHWT).
As I stated before, the Earth’s orbit around the Sun is not fixed. Milankovitch discovered that it varies in three main ways, of which all have an impact on its climate. The three Milankovitch cycles are:
Eccentricity
The Earth’s orbit around the Sun is not spherical but in fact elliptical. When the distance between the Earth and Sun is greatest this is called ‘aphelion’ (see figure below) and when it’s at its shortest, ‘perihelion’. The elliptical orbit can vary greatly. The two extremes of the Earth’s eccentricity can be seen on the diagram summarising the Milakovitch cycles below. The variation between summer and winter temperatures is at its most extreme when the difference between aphelion and perihelion is largest. The time it takes for the Earth’s orbit to change from its most elliptical shape to its most spherical and back again is ~95,000-100,000 years. This period of time is known as its cycle.
The Earth’s axis is currently on a tilt of 23.45⁰ however this can vary from 22.1-24.3⁰ over a ~41,000 year cycle. When the angle is decreased the difference between summer and winter climates is less extreme.
Precession
As well as the Earth’s axis being tilted it also wobbles about this axis. Think of a spinning top just before is comes to a rest. Currently the North Pole is pointing towards the North Star, however in ~12,000 years’ time it will be pointing in a completely different direction which will make NHWT in June and summer time will be in December! A full cycle takes 19,000-24,000 years to complete. As the precession is effectively swapping our seasons this has a large impact on the temperature of the Earth, as well as its climate.
For those of you who read my first blog post you will recognise the next figure but hopefully now the cycles in the Earth’s temperature will make more sense to you. You can definitely see the impact of the Milankovitch cycles within the plot. These sorts of temperature plots have sometimes been used by climate sceptics to show the degree of natural variability in the Earth’s Climate and how current climate change is minimal compared to the past. This is extremely difficult to justify, especially when comparing two extremely different timescales. As you can see from the plot below we are actually in one of the Earth’s warmer periods on this timescale, so if anything we should be expecting Earth to be moving into a cooler period in the future. However the rate of global warming we have experienced in the last 150 years has not occurred for several million years. As I said in my last blog post I will do a future post about the history of the Earth’s temperature in more detail, however next time it’ll be more chemistry with a brief introduction into aerosols!
Record of the Earth’s temperature and Carbon Dioxide concentrations taken from ice core data in Antarctica.


