The El Niño Southern Oscillation (ENSO) is a natural phenomenon that occurs in the Pacific Ocean around the equator every 2-7 years. Weather systems on the West Coast of the Americas, the East Coast of Australia and East Asia can all be affected by this phenomenon.
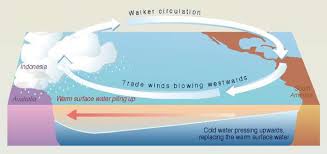
The ENSO oscillates between two phases: El Niño and La Niña (meaning ‘the boy’ and ‘the girl’ respectively in Spanish. The boy can also be a specific reference to the Christ child. I am unsure why they were named this however!). These phases are the two extremes of this oscillation. To explain them in more detail I first need to explain the ‘normal’ state of the Tropical Pacific Ocean. The eastern Pacific normally has atmospheric higher pressures than the west, this causes easterly winds (from the Americas to Australia) blowing along the equator. These winds take with them warm moist air which rises up and turns into rain. This elevated air then travels back to the east creating the ‘Walker circulation’. A diagram showing this circulation is shown below. The winds blowing westwards move the warm sea surface water. This then causes the deeper (and colder) water to rise up to the surface in the east producing a temperature gradient along the equator.

Original found here.
The Walker circulation is responsible for countries like Indonesia experiencing warm downpours of rain, especially in the northern hemisphere winter months. However, when ENSO is in its El Niño phase the areas of high and low pressure reverse, therefore changing the wind direction. This drives the warm sea surface waters back to the east, taking with it the rain.
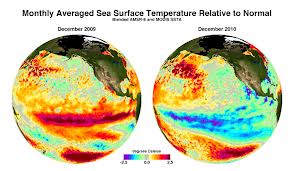
The La Niña phase is when the ‘normal’ conditions are more extreme, i.e. the easterly winds are even stronger and the pressure difference is even greater. This means even more warm water is moved towards Australia and East Asia. The diagram below shows the sea surface temperature anomalies for El Niño (left) and La Niña (right) events. El Niño has higher than average temperatures because the warm water has been moved back towards the east whereas La Niña shows the surface is much colder than average as all the warm water has been shifted even more westward.

Original can be found here.
ENSO affects the weather systems of the world in different ways, many of which are summarised in the diagram below. Unlike the North Atlantic Oscillation which was the subject of my last blog (please click here to see) this oscillation does not directly influence Europe’s weather. El Niño years tend to give a warmer global temperature average especially in the winter, whereas La Niña years will give cooler than average winters. It is also thought that during La Niña events more tornadoes are experienced, although no mechanism for this has so far been provided .

Original image from here.
The video below is a basic but well explained summary of how ENSO affects the weather in Australia and is worth a watch.
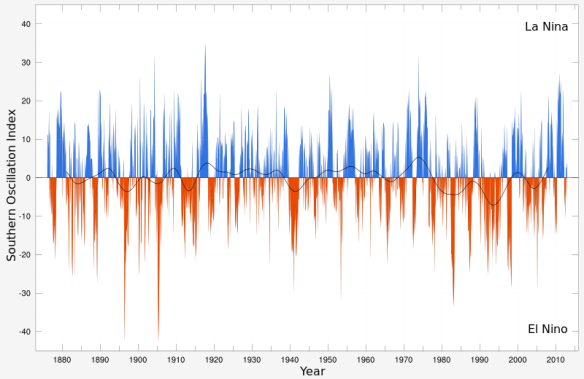
The intensity of the El Niño / La Niña phase can be quantified by an index where positive and negative values represent La Niña and El Niño respectively. A time series for the last ~130 years is shown below. In the future, as a result of global warming, it is predicted that there may be more El Niño events, as in recent decades, however more observational data is needed to improve the confidence of these results.

Original from here.
The final video below is an overall summary of ENSO, and helps to visualise the oscillation more clearly. It’s a little over 4 minutes long but you miss nothing by skipping the first 25 seconds.
Thanks for reading!
