
This blog post will give a brief overview of how the Earth’s temperature has changed up to the present day. We only have actual temperature measurements going back a couple of hundred years however there are several other methods we can use to give reliable estimates of the Earth’s temperature in the past. ‘Proxy’ measurements include rock sediment sampling, tree rings and ice cores. The video below gives a good introduction to how the British Antarctic Survey use ice cores to generate accurate atmospheric gas and temperature records going back 800,000 years! The diagram below shows an overview of the Earth’s temperature from 500 million years ago to the present and may help with picturing the changes in temperature when reading this post.
Very Early Earth’s History (4.5 billion – 3.8 billion years ago)
The Earth was formed roughly 4.5 billion years ago. Until 3.8 billion years ago it was a completely inhospitable environment with the surface being mainly molten lava. The Earth eventually cooled enough for its crust to form. Land masses could then exist and, when it was cold enough to rain, the oceans formed. Around this time the atmosphere was predominantly consisted of methane (CH4) and ammonia (NH3), two extremely important greenhouse gases, thus their radiative forcing kept the Earth’s atmosphere warm and toasty!
The Oxygen Explosion (2.5 billion – 500 million years ago)
Oxygen (O2) in the atmosphere was almost non-existent until ~2.5 billion years ago. The evolution of cyanobacteria, which produced oxygen as a bi-product of photosynthesis, meant that O2 levels dramatically increased. This rapid change in atmospheric composition caused widespread extinctions of most of the previous anaerobic bacteria. This ‘new’ atmosphere made the Earth much colder as there were no longer bacteria emitting radiative forcing-methane and carbon dioxide into the atmosphere. It is thought that the average temperature at the equator was roughly the same as current Antarctic conditions!
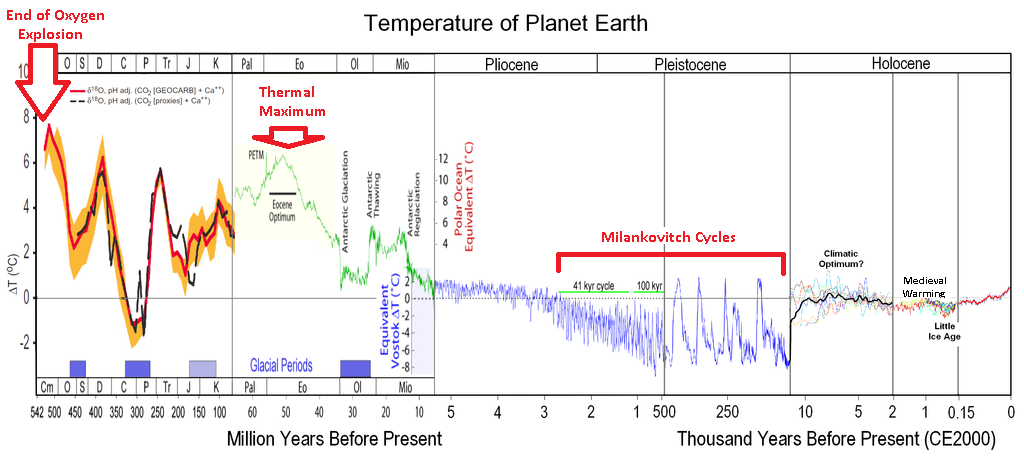
History of the Earth’s Temperature. originally sourced from here.
500 – 250 million years ago
During this period the Earth’s atmosphere became more stable, eventually cooling to similar temperatures to today’s average (see first section on plot above where the temp change is ~0 ΔT).
Animal Evolution (250 – 65 million years ago)
During this time the evolution of aerobically respiring animals occurred, i.e. DINOSAURS! This meant the concentration of CO2 increased and global temperatures increased again. We know that there was a sudden decrease in temperatures around 65 million years ago which resulted in the extinction of the dinosaurs. The most widely accepted reason for this is a massive comet hitting the Earth sending huge amounts of matter (read: aerosols) into the atmosphere. This caused a global decrease in temperature due to an increased albedo effect (for more information about this and the contribution of aerosols to this effect please read my previous blog: An introduction to aerosols).
Ice Age (35 million years ago)
The thermal maximum continued to around 35 million years ago when the Earth cooled into the Ice Age. The theory behind this change in temperature is that a type of fern named Azolla became extinct. The Azolla then sank to the bottom of the ocean, taking with it much of the carbon absorbed as carbon dioxide, therefore removing it from the atmosphere. With the carbon dioxide not present to act as a greenhouse gas, global temperatures decreased again. Unlike the last period of cooling, this time the Earth had fully formed continents, including mountain ranges, and land mass at the South Pole (Antarctica). This new land coverage helped amplify the cooling via circulation.
An ice age is defined as when a planet’s poles are covered with ice, so technically we are still in one! Within an ice age there are periods of glacials and inter-glacials. Glacials are episodes of colder temperatures whereas inter-glacials are warmer time phases. Both will last several thousands of years. These changes in climate can be explained with the Milankovitch cycles (please read post #2 – The Milankovitch Cycles – for more information). NB: You can see on the plot above sections labelled ‘the mini ice age’ and ‘the medieval warming’ period. I plan to do future blogs on these events as this post is getting far too long!
Recent Warming (1880 – present day)
The warming we have seen in recent years has been like nothing experienced before in the Earth’s history. The last 100 years of warming has cancelled out the previous 6000 years of cooling that occurred before. The video below (sourced from NASA) shows just how dramatic the rate of global warming is over this time period.
Thanks for reading to the end of this post, it ended up a bit too long! Next time I want to introduce an event called the Northern Atlantic Oscillation: the phenomenon that is thought to have caused the medieval warming period.


